Computes and plots the principal components of the genes, eventually displaying the samples as in a typical biplot visualization.
genespca(
  x,
  ntop,
  choices = c(1, 2),
  arrowColors = "steelblue",
  groupNames = "group",
  biplot = TRUE,
  scale = 1,
  pc.biplot = TRUE,
  obs.scale = 1 - scale,
  var.scale = scale,
  groups = NULL,
  ellipse = FALSE,
  ellipse.prob = 0.68,
  labels = NULL,
  labels.size = 3,
  alpha = 1,
  var.axes = TRUE,
  circle = FALSE,
  circle.prob = 0.69,
  varname.size = 4,
  varname.adjust = 1.5,
  varname.abbrev = FALSE,
  returnData = FALSE,
  coordEqual = FALSE,
  scaleArrow = 1,
  useRownamesAsLabels = TRUE,
  point_size = 2,
  annotation = NULL
)
Arguments
- x
A
DESeq2::DESeqTransform()object, with data inassay(x), produced for example by eitherDESeq2::rlog()orDESeq2::varianceStabilizingTransformation()- ntop
Number of top genes to use for principal components, selected by highest row variance
- choices
Vector of two numeric values, to select on which principal components to plot
- arrowColors
Vector of character, either as long as the number of the samples, or one single value
- groupNames
Factor containing the groupings for the input data. Is efficiently chosen as the (interaction of more) factors in the colData for the object provided
- biplot
Logical, whether to additionally draw the samples labels as in a biplot representation
- scale
Covariance biplot (scale = 1), form biplot (scale = 0). When scale = 1, the inner product between the variables approximates the covariance and the distance between the points approximates the Mahalanobis distance.
- pc.biplot
Logical, for compatibility with biplot.princomp()
- obs.scale
Scale factor to apply to observations
- var.scale
Scale factor to apply to variables
- groups
Optional factor variable indicating the groups that the observations belong to. If provided the points will be colored according to groups
- ellipse
Logical, draw a normal data ellipse for each group
- ellipse.prob
Size of the ellipse in Normal probability
- labels
optional Vector of labels for the observations
- labels.size
Size of the text used for the labels
- alpha
Alpha transparency value for the points (0 = transparent, 1 = opaque)
- var.axes
Logical, draw arrows for the variables?
- circle
Logical, draw a correlation circle? (only applies when prcomp was called with scale = TRUE and when var.scale = 1)
- circle.prob
Size of the correlation circle in Normal probability
- varname.size
Size of the text for variable names
- varname.adjust
Adjustment factor the placement of the variable names, '>= 1' means farther from the arrow
- varname.abbrev
Logical, whether or not to abbreviate the variable names
- returnData
Logical, if TRUE returns a data.frame for further use, containing the selected principal components for custom plotting
- coordEqual
Logical, default FALSE, for allowing brushing. If TRUE, plot using equal scale cartesian coordinates
- scaleArrow
Multiplicative factor, usually >=1, only for visualization purposes, to allow for distinguishing where the variables are plotted
- useRownamesAsLabels
Logical, if TRUE uses the row names as labels for plotting
- point_size
Size of the points to be plotted for the observations (genes)
- annotation
A
data.frameobject, with row.names as gene identifiers (e.g. ENSEMBL ids) and a column,gene_name, containing e.g. HGNC-based gene symbols
Value
An object created by ggplot, which can be assigned and further customized.
Details
The implementation of this function is based on the beautiful ggbiplot
package developed by Vince Vu, available at https://github.com/vqv/ggbiplot.
The adaptation and additional parameters are tailored to display typical genomics data
such as the transformed counts of RNA-seq experiments
Examples
library(DESeq2)
dds <- makeExampleDESeqDataSet_multifac(betaSD_condition = 3, betaSD_tissue = 1)
rlt <- rlogTransformation(dds)
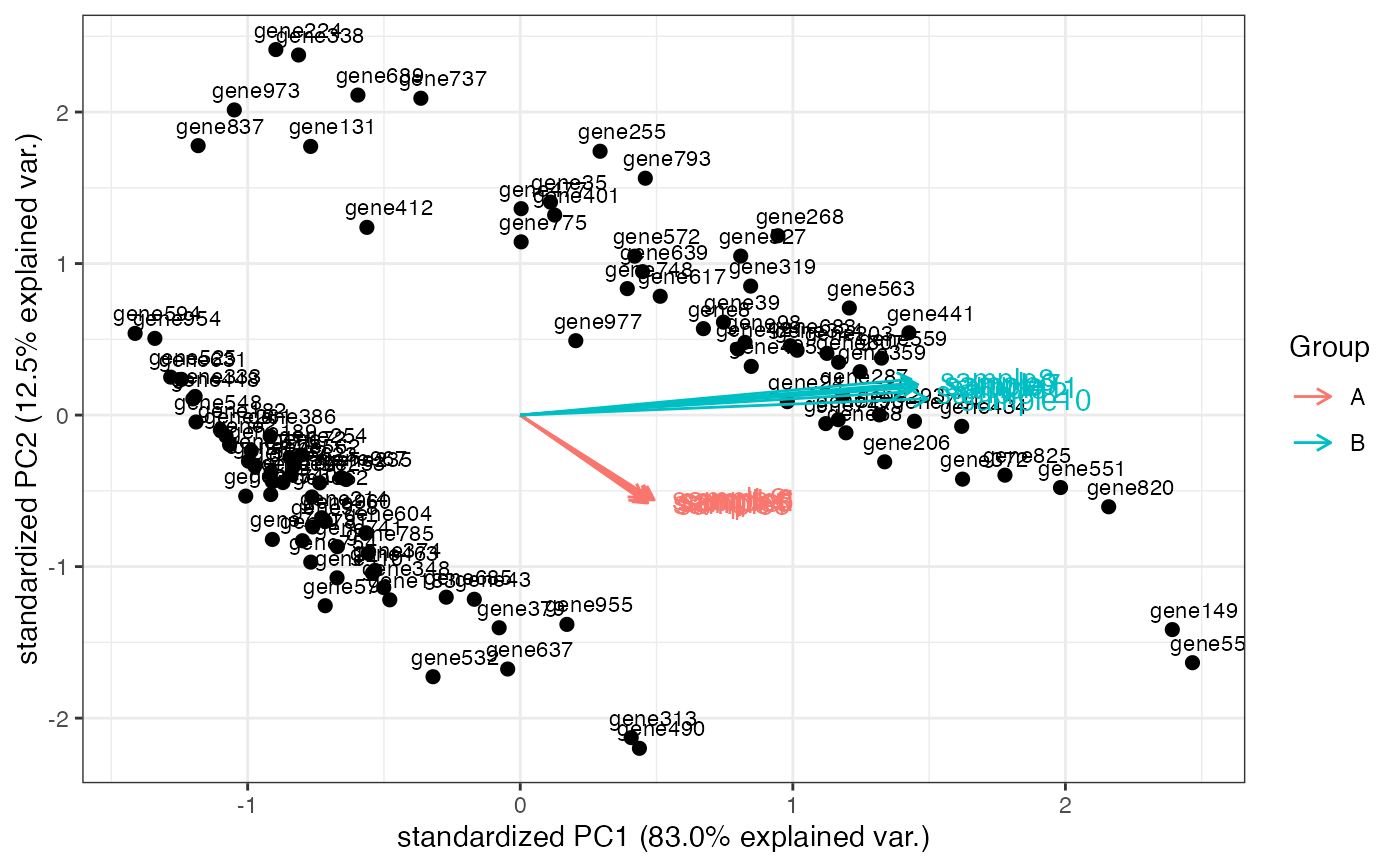
groups <- colData(dds)$condition
groups <- factor(groups, levels = unique(groups))
cols <- scales::hue_pal()(2)[groups]
genespca(rlt, ntop=100, arrowColors = cols, groupNames = groups)
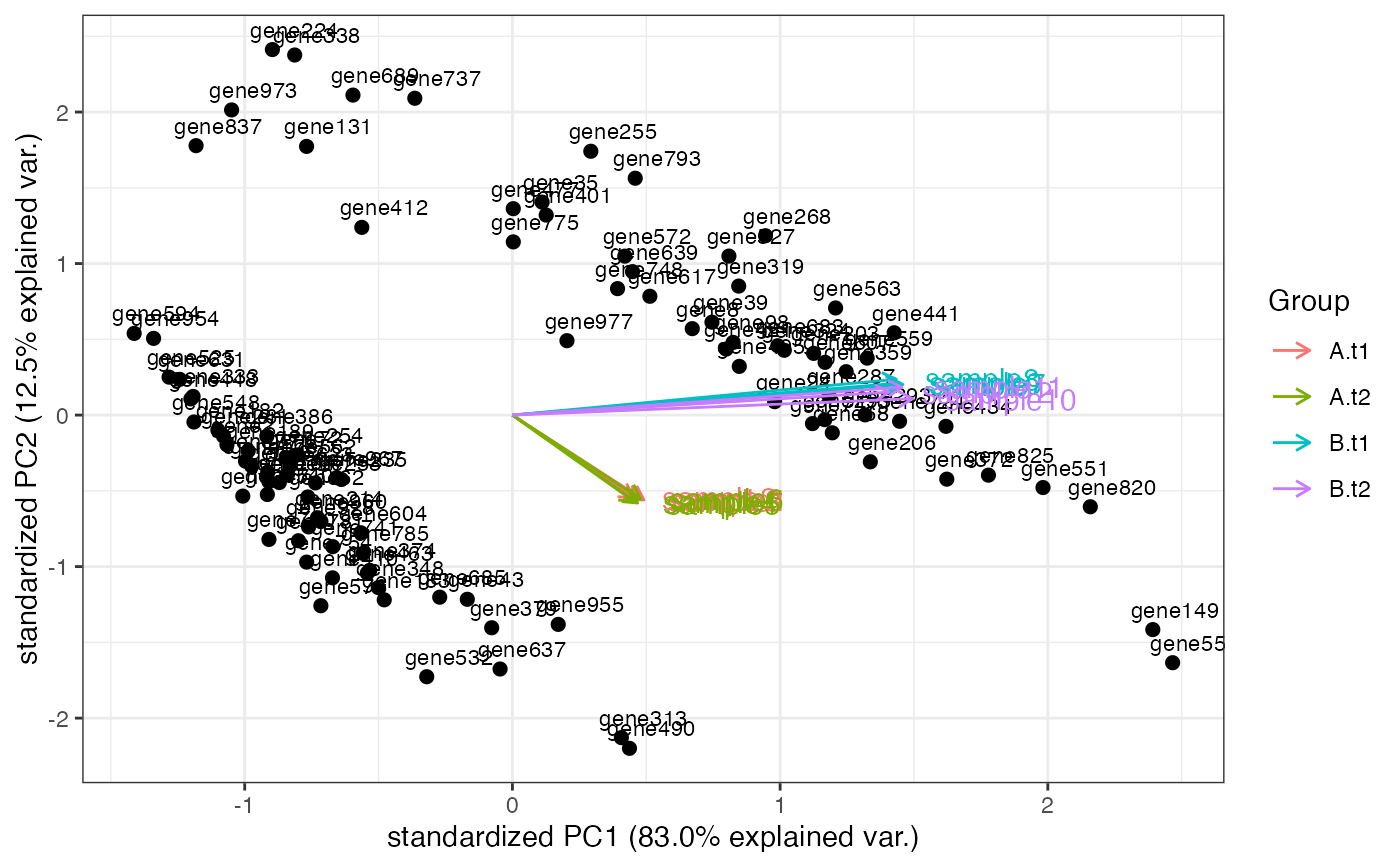
 groups_multi <- interaction(as.data.frame(colData(rlt)[, c("condition", "tissue")]))
groups_multi <- factor(groups_multi, levels = unique(groups_multi))
cols_multi <- scales::hue_pal()(length(levels(groups_multi)))[factor(groups_multi)]
genespca(rlt, ntop = 100, arrowColors = cols_multi, groupNames = groups_multi)
groups_multi <- interaction(as.data.frame(colData(rlt)[, c("condition", "tissue")]))
groups_multi <- factor(groups_multi, levels = unique(groups_multi))
cols_multi <- scales::hue_pal()(length(levels(groups_multi)))[factor(groups_multi)]
genespca(rlt, ntop = 100, arrowColors = cols_multi, groupNames = groups_multi)