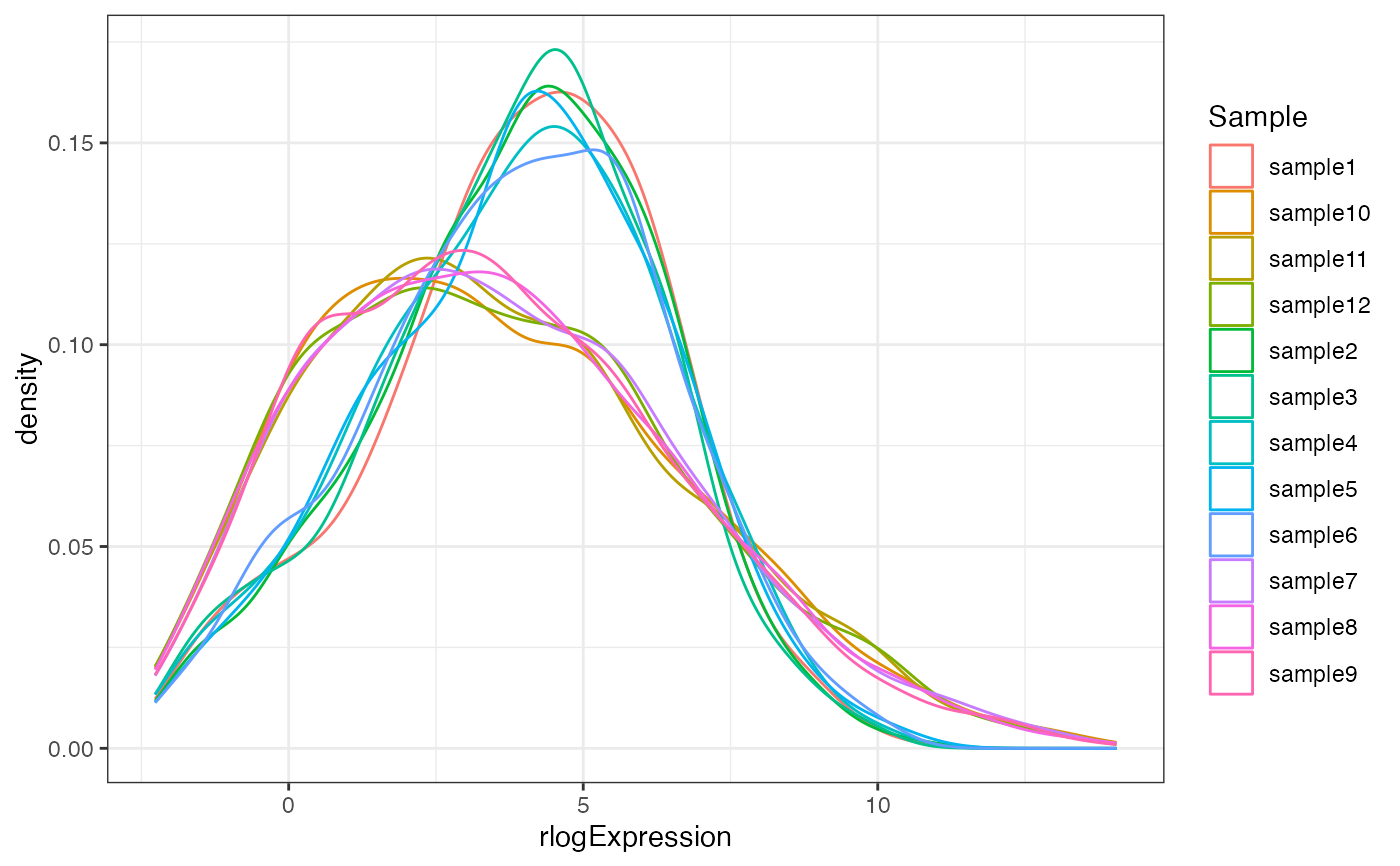
Plot distribution of expression values
distro_expr(rld, plot_type = "density")Arguments
- rld
A
DESeq2::DESeqTransform()object.- plot_type
Character, choose one of
boxplot,violinordensity. Defaults todensity
Value
A plot with the distribution of the expression values
Examples
dds <- makeExampleDESeqDataSet_multifac(betaSD_condition = 3, betaSD_tissue = 1)
rlt <- DESeq2::rlogTransformation(dds)
distro_expr(rlt)
#> Warning: `aes_string()` was deprecated in ggplot2 3.0.0.
#> ℹ Please use tidy evaluation idioms with `aes()`.
#> ℹ See also `vignette("ggplot2-in-packages")` for more information.
#> ℹ The deprecated feature was likely used in the pcaExplorer package.
#>   Please report the issue at
#>   <https://github.com/federicomarini/pcaExplorer/issues>.