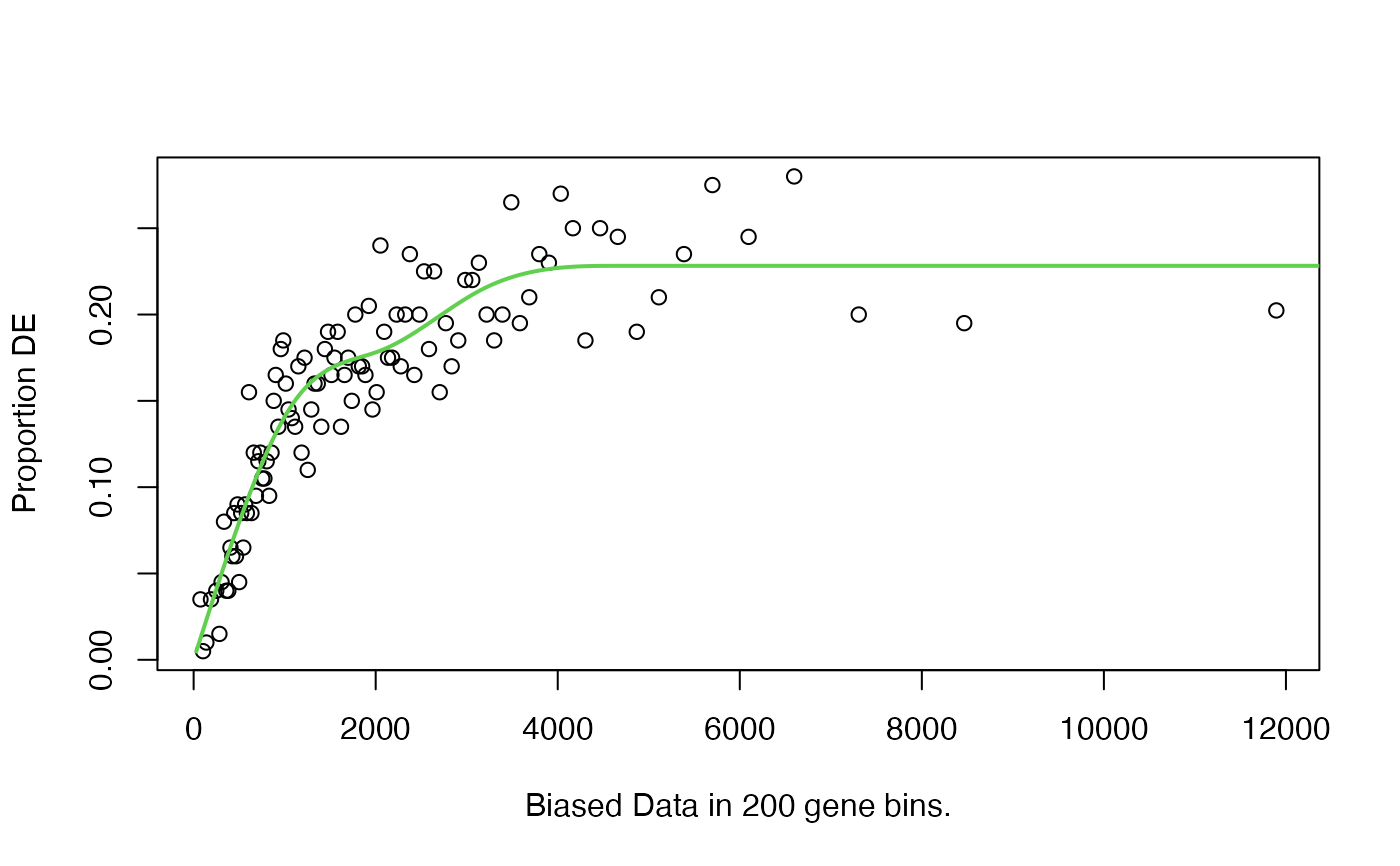
Plots the Probability Weighting Function created by nullp by
binning together genes.
Usage
plotPWF(
  pwf,
  binsize = "auto",
  pwf_col = 3,
  pwf_lwd = 2,
  xlab = "Biased Data in <binsize> gene bins.",
  ylab = "Proportion DE",
  ...
)
Arguments
- pwf
A data frame with 3 columns named DEgenes, bias.data & pwf and row names giving the gene names. Usually generated by
nullp.- binsize
Calculate and plot the fraction of genes that are DE in bins of this size. If set to "auto" the best binsize for visualization is attempted to be found automatically.
- pwf_col
The colour of the probability weighting function
- pwf_lwd
The width of the probability weighting function
- xlab
The x-axis label.
<binsize>is replaced by the binsize used.- ylab
The y-axis label.
- ...
Extra arguments that are passed to plot.
Details
This function is almost always called using the output from the
nullp function. However, it can be used to visualize the
length (or any other type of quantifiable) bias in ability to detect DE in a
data set. The pwf argument needs to be a data frame with 3 columns
each containing numeric entries (although NAs are permitted in the bias.data
and pwf columns), which must be named "DEgenes", "bias.data" and "pwf",
although they can appear in any order. The row names are taken to be the
gene names. The DEgenes column should be 0s or 1s where 1 represents a DE
gene, 0 a gene which is not DE. The bias.data column is a quantification of
the quantity for which there is a bias in detecting DE for the associated
gene, this is usually gene length or the number of counts associated with a
gene. Finally, the pwf column gives the probability weighting to be applied
for a given gene.
References
Young, M. D., Wakefield, M. J., Smyth, G. K., Oshlack, A. (2010) Gene ontology analysis for RNA-seq: accounting for selection bias Genome Biology Date: Feb 2010 Vol: 11 Issue: 2 Pages: R14
Author
Matthew D. Young myoung@wehi.edu.au