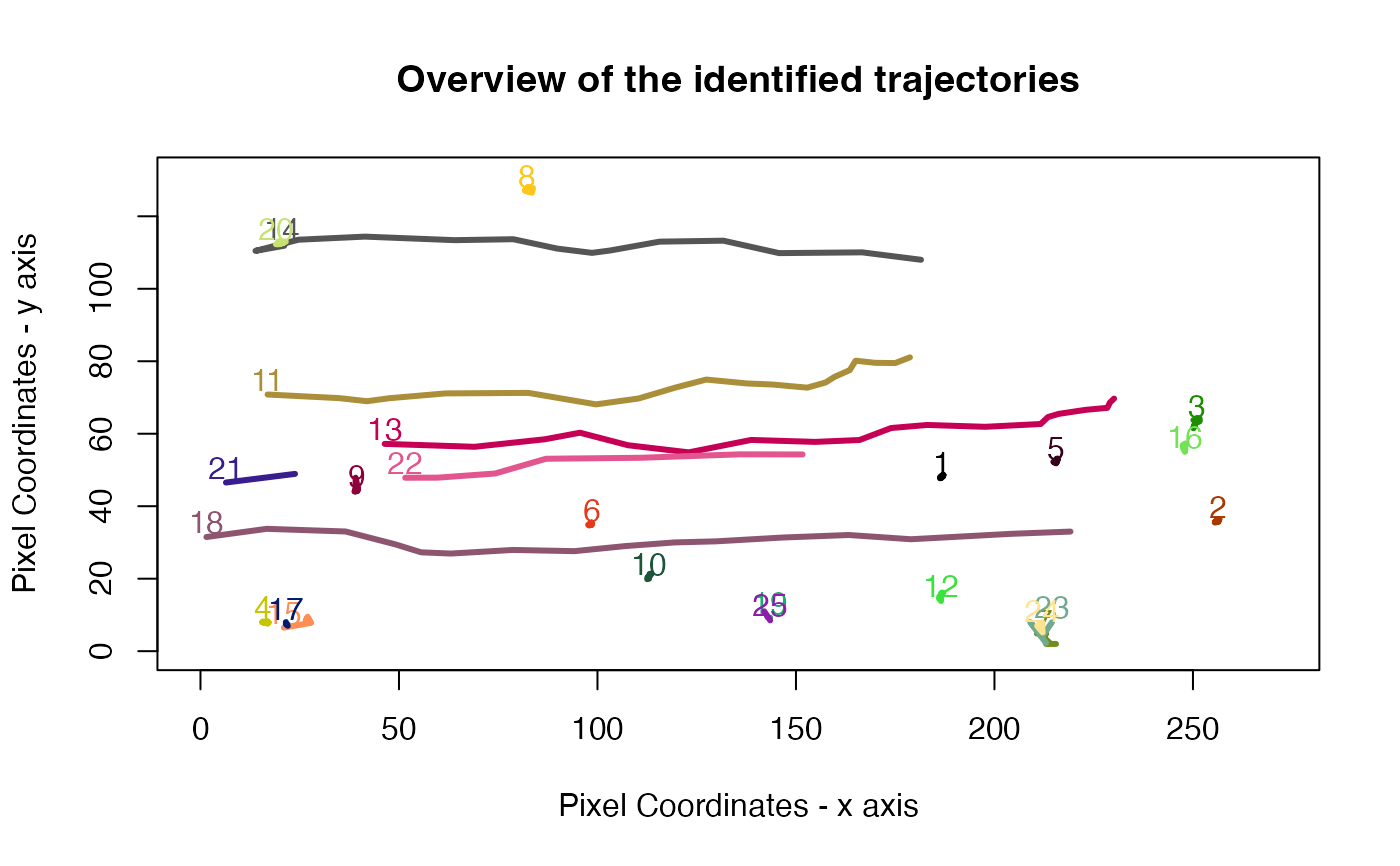
Provides a bird's eye view of a TrajectorySet object on a bidimensional space
plot2D.TrajectorySet(
  trajectoryset,
  frames,
  trajIDs = NULL,
  addGrid = FALSE,
  verbose = FALSE,
  ...
)
Arguments
- trajectoryset
A
TrajectorySetobject- frames
A
Framesobject, used here to identify the limits of the region of interest- trajIDs
A vector containing the ids of the desired trajectories
- addGrid
Logical, add an additional grid to the 2-dimensional plot (visual aid for backtracking trajectory point locations)
- verbose
Logical, whether to provide additional output on the command line
- ...
Arguments to be passed to methods
Value
plot2D.TrajectorySet returns an invisible NULL.
Details
This function extracts the region of interests from the dimensions
of an image of the Frames object,
and afterwards plots the x-y-time representation of the identified
trajectories on a 2d plane. It is possible to subset the TrajectorySet
object with the IDs of the desired trajectories
Examples
data("MesenteriumSubset")
data("candidate.platelets")
platelets.trajectories <- trajectories(candidate.platelets)
#> Input ParticleSet is not a LinkedParticleSet.
#> Performing linking first with some set of default parameters - you might want to change them according to your scenario...
plot2D.TrajectorySet(platelets.trajectories,MesenteriumSubset)