Create a summary heatmap. The input arguments for this functions are
typically generated using bettrGetReady, which ensures that
all required columns are available.
Usage
makeHeatmap(
  bettrList = NULL,
  plotdata,
  scoredata,
  idCol,
  metricCol = "Metric",
  valueCol = "ScaledValue",
  weightCol = "Weight",
  scoreCol = "Score",
  metricGroupCol = "metricGroup",
  metricInfo,
  metricColors,
  idInfo,
  idColors,
  metricCollapseGroup = FALSE,
  metricGrouping = "---",
  labelSize = 10,
  showRowNames = TRUE,
  plotType = "Heatmap",
  rownamewidth_cm = 6,
  colnameheight_cm = 6
)
Arguments
- bettrList
A
list, the output object fromprepData. IfbettrListis provided, argumentsplotdata,scoredata,idCol,metricCol,valueCol,weightCol,scoreCol,metricGroupCol,metricInfo,metricColors,idInfo,idColors,metricCollapseGroup,metricGroupingandmethodswill be ignored and the corresponding values will be extracted frombettrList. This is the recommended way of calling the plotting functions, as it ensures compatibility of all components.- plotdata
A
data.framewith columns representing methods, metrics, scores, and weights. Typically obtained asprepData$plotdata, whereprepDatais the output frombettrGetReady.- scoredata
A
data.framewith columns representing methods, aggregated scores, and any other method annotations. Typically obtained asprepData$scoredata, whereprepDatais the output frombettrGetReady.- idCol
Character scalar indicating which column of
plotdataandscoredatacontains the method IDs.- metricCol
Character scalar indicating which column of
plotdatacontains the metric IDs. Typically,"Metric".- valueCol
Character scalar indicating which column of
plotdatacontains the metric values. Typically,"ScaledValue".- weightCol
Character scalar indicating which column of
plotdatacontains the weight values. Typically,"Weight".- scoreCol
Character scalar indicating which column of
scoredatacontains the aggregated score values. Typically,"Score".- metricGroupCol
Character scalar indicating which column of
plotdatacontains the information about the metric group. Typically,"metricGroup".- metricInfo
data.framewith annotations for metrics. Typically obtained asprepData$metricInfo, whereprepDatais the output frombettrGetReady.- metricColors
Named list with colors used for the metrics and any other metric annotations. Typically obtained as
prepData$metricColors, whereprepDatais the output frombettrGetReady.- idInfo
data.framewith annotations for entities. Typically obtained asprepData$idInfo, whereprepDatais the output frombettrGetReady.- idColors
Named list with colors used for methods and any other method annotations. Typically obtained as
prepData$idColors, whereprepDatais the output frombettrGetReady.- metricCollapseGroup
Logical scalar indicating whether metrics should be collapsed by the group variable provided by
metricGrouping. Typically obtained asprepData$metricCollapseGroup, whereprepDatais the output frombettrGetReady.- metricGrouping
Character scalar indicating the column of
metricInfothat was used to group metrics. Typically obtained asprepData$metricGrouping, whereprepDatais the output frombettrGetReady.- labelSize
Numeric scalar providing the size of the labels in the plot.
- showRowNames
Logical scalar indicating whether to show row (method) names in the heatmap.
- plotType
Either
"Heatmap"or"Dot plot"indicating the type of plot to construct.- rownamewidth_cm, colnameheight_cm
Numeric scalars defining the width of row names and height of column names, in cm.
Value
A HeatmapList object.
Examples
## Generate example data
df <- data.frame(Method = c("M1", "M2", "M3"),
metric1 = c(1, 2, 3),
metric2 = c(3, 1, 2))
metricInfo <- data.frame(Metric = c("metric1", "metric2", "metric3"),
Group = c("G1", "G2", "G2"))
idInfo <- data.frame(Method = c("M1", "M2", "M3"),
Type = c("T1", "T1", "T2"))
prepData <- bettrGetReady(df = df, idCol = "Method",
metricInfo = metricInfo, idInfo = idInfo)
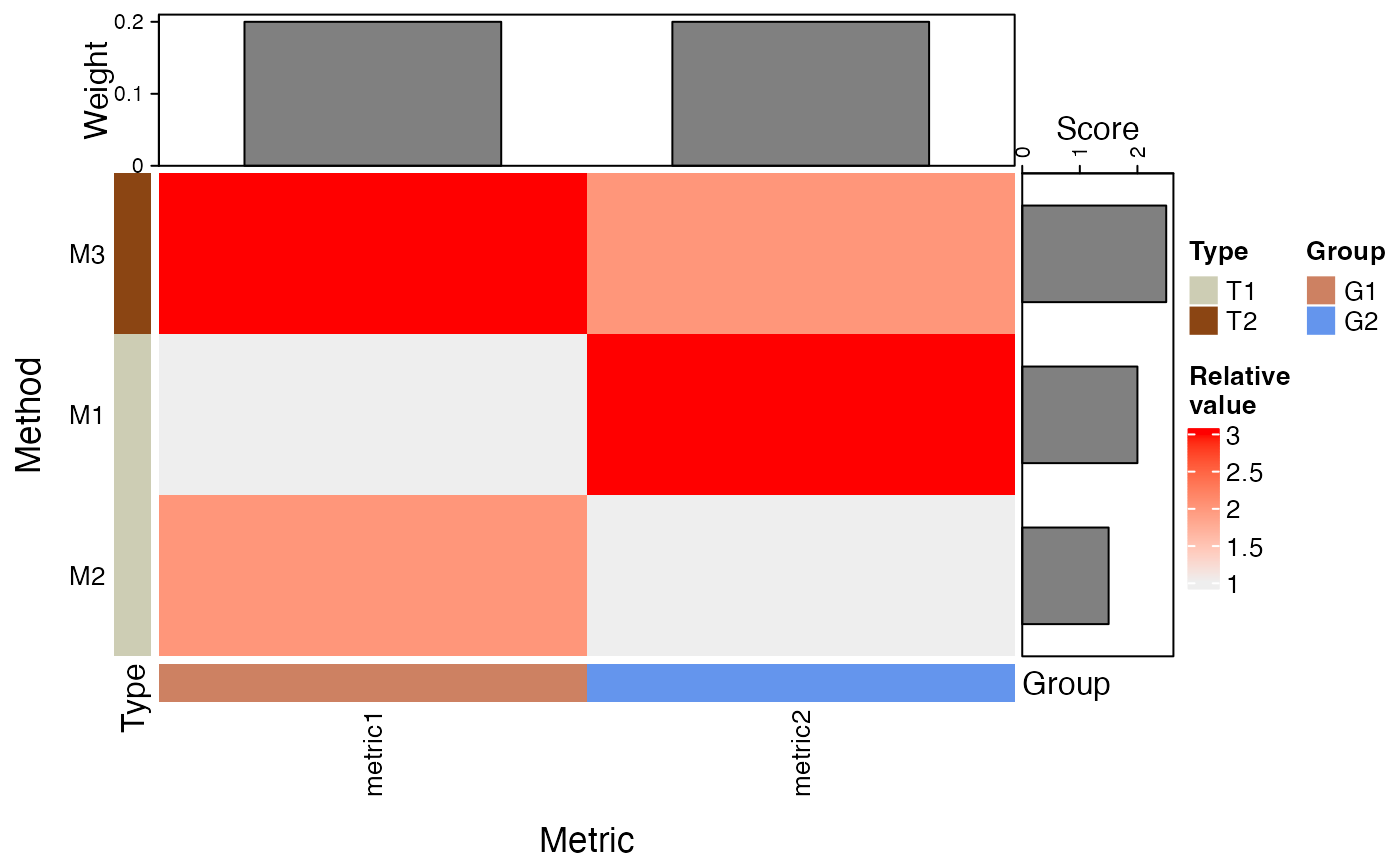
makeHeatmap(bettrList = prepData, plotType = "Heatmap")
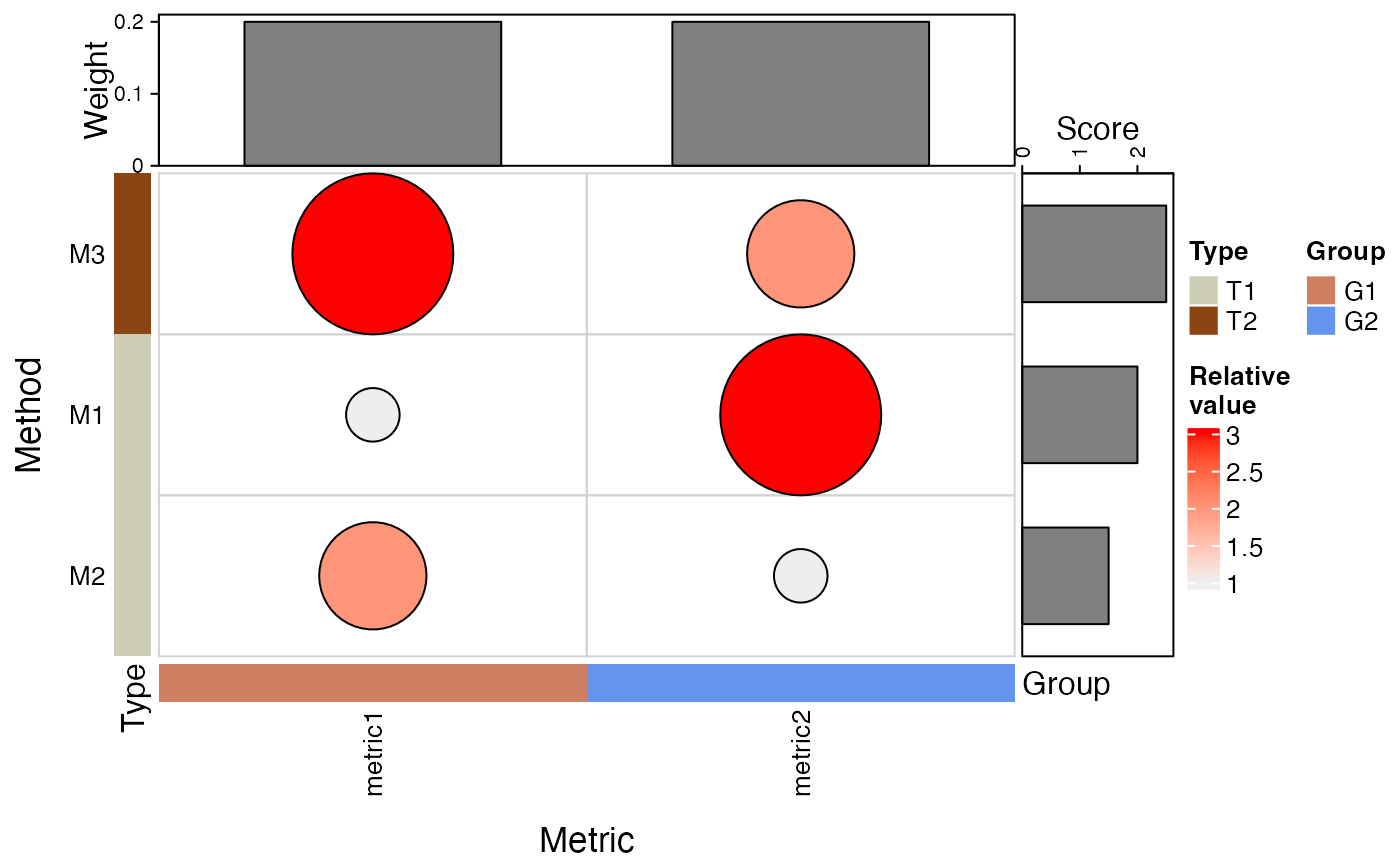
 makeHeatmap(bettrList = prepData, plotType = "Dot plot")