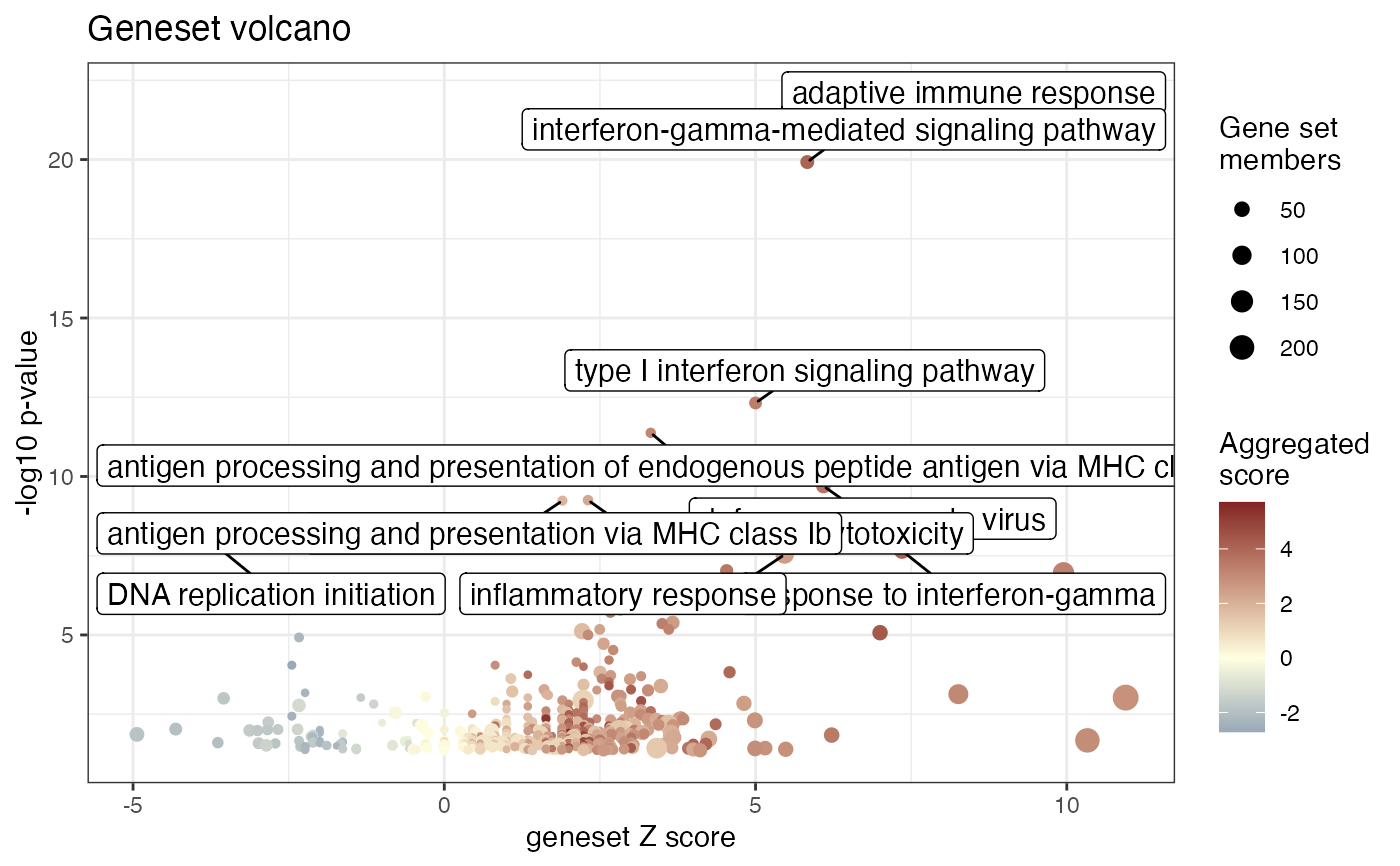
Volcano plot for gene sets, to summarize visually the functional enrichment results
gs_volcano(
  res_enrich,
  gtl = NULL,
  p_threshold = 0.05,
  color_by = "aggr_score",
  volcano_labels = 10,
  scale_circles = 1,
  gs_ids = NULL,
  plot_title = NULL
)
Arguments
- res_enrich
A
data.frameobject, storing the result of the functional enrichment analysis. See more in the main function,GeneTonic(), to check the formatting requirements (a minimal set of columns should be present). This object needs to be processed first by a function such asget_aggrscores()to compute the term-wisez_scoreoraggr_score, which will be used for plotting- gtl
A
GeneTonic-list object, containing in its slots the arguments specified above:dds,res_de,res_enrich, andannotation_obj- the names of the list must be specified following the content they are expecting- p_threshold
Numeric, defines the threshold to be used for filtering the gene sets to display. Defaults to 0.05
- color_by
Character specifying the column of
res_enrichto be used for coloring the plotted gene sets. Defaults toaggr_score.- volcano_labels
Integer, maximum number of labels for the gene sets to be plotted as labels on the volcano scatter plot.
- scale_circles
A numeric value, to define the scaling factor for the circle sizes. Defaults to 1.
- gs_ids
Character vector, containing a subset of
gs_idas they are available inres_enrich. Lists the gene sets to be labeled.- plot_title
Character string, used as title for the plot. If left
NULL, it defaults to a general description of the plot and of the DE contrast
Value
A ggplot object
Details
It is also possible to reduce the redundancy of the input res_enrich object,
if it is passed in advance to the gs_simplify() function.
See also
gs_simplify() can be applied in advance to res_enrich to reduce
the redundancy of the displayed gene sets
Examples
library("macrophage")
library("DESeq2")
library("org.Hs.eg.db")
library("AnnotationDbi")

# dds object
data("gse", package = "macrophage")
dds_macrophage <- DESeqDataSet(gse, design = ~ line + condition)
#> using counts and average transcript lengths from tximeta
rownames(dds_macrophage) <- substr(rownames(dds_macrophage), 1, 15)
dds_macrophage <- estimateSizeFactors(dds_macrophage)
#> using 'avgTxLength' from assays(dds), correcting for library size

# annotation object
anno_df <- data.frame(
  gene_id = rownames(dds_macrophage),
  gene_name = mapIds(org.Hs.eg.db,
    keys = rownames(dds_macrophage),
    column = "SYMBOL",
    keytype = "ENSEMBL"
  ),
  stringsAsFactors = FALSE,
  row.names = rownames(dds_macrophage)
)
#> 'select()' returned 1:many mapping between keys and columns

# res object
data(res_de_macrophage, package = "GeneTonic")
res_de <- res_macrophage_IFNg_vs_naive

# res_enrich object
data(res_enrich_macrophage, package = "GeneTonic")
res_enrich <- shake_topGOtableResult(topgoDE_macrophage_IFNg_vs_naive)
#> Found 500 gene sets in `topGOtableResult` object.
#> Converting for usage in GeneTonic...
res_enrich <- get_aggrscores(res_enrich, res_de, anno_df)

gs_volcano(res_enrich)
#> Warning: Removed 17 rows containing missing values or values outside the scale range
#> (`geom_point()`).