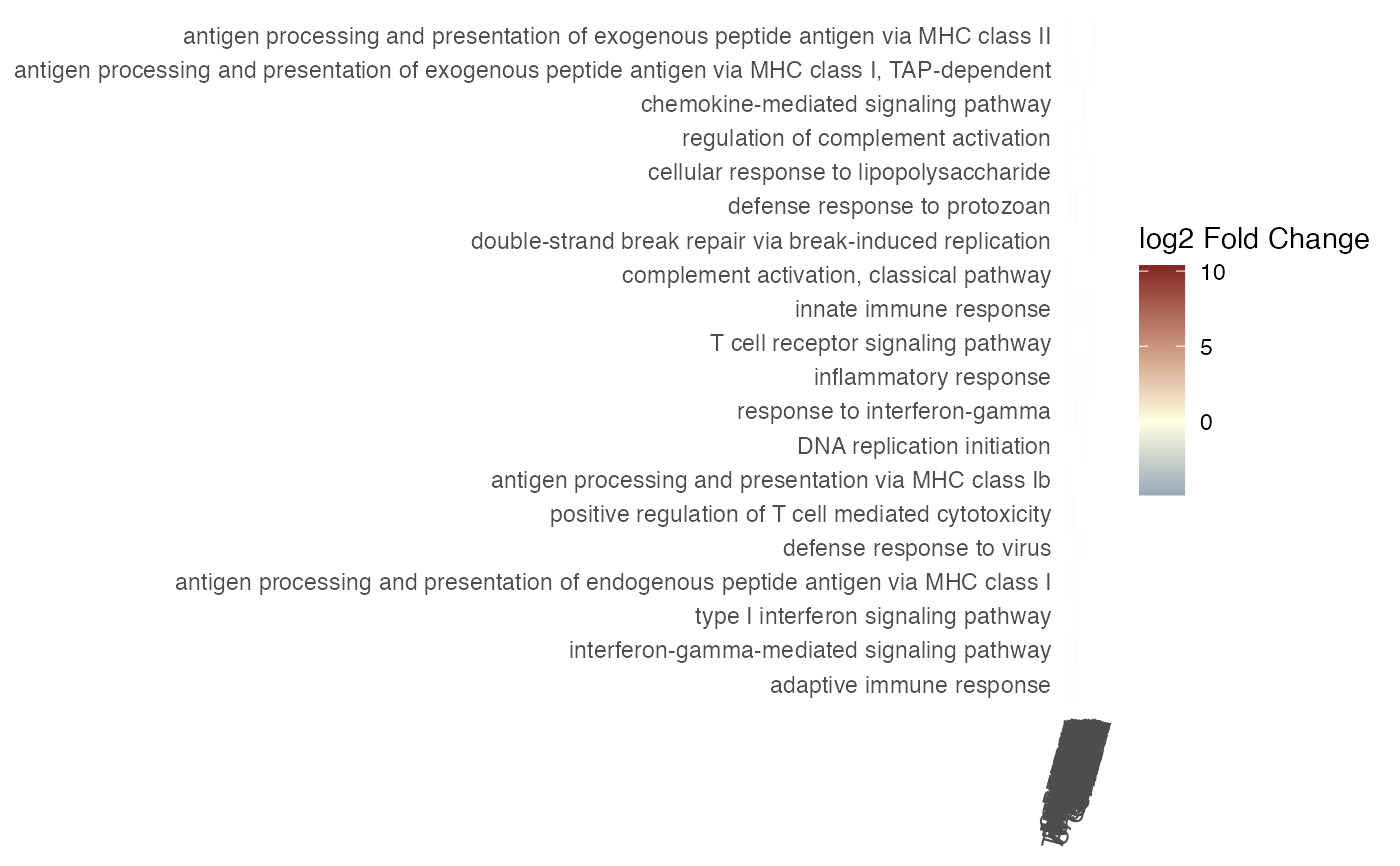
Plots a heatmap for genes and genesets, useful to spot out intersections across genesets and an overview of them
gs_summary_heat(res_enrich, res_de, annotation_obj, gtl = NULL, n_gs = 80)Arguments
- res_enrich
A
data.frameobject, storing the result of the functional enrichment analysis. See more in the main function,GeneTonic(), to check the formatting requirements (a minimal set of columns should be present).- res_de
A
DESeqResultsobject.- annotation_obj
A
data.frameobject with the feature annotation information, with at least two columns,gene_idandgene_name.- gtl
A
GeneTonic-list object, containing in its slots the arguments specified above:dds,res_de,res_enrich, andannotation_obj- the names of the list must be specified following the content they are expecting- n_gs
Integer value, corresponding to the maximal number of gene sets to be displayed
Value
A ggplot object
Examples
library("macrophage")
library("DESeq2")
library("org.Hs.eg.db")
library("AnnotationDbi")

# dds object
data("gse", package = "macrophage")
dds_macrophage <- DESeqDataSet(gse, design = ~ line + condition)
#> using counts and average transcript lengths from tximeta
rownames(dds_macrophage) <- substr(rownames(dds_macrophage), 1, 15)
dds_macrophage <- estimateSizeFactors(dds_macrophage)
#> using 'avgTxLength' from assays(dds), correcting for library size

# annotation object
anno_df <- data.frame(
  gene_id = rownames(dds_macrophage),
  gene_name = mapIds(org.Hs.eg.db,
    keys = rownames(dds_macrophage),
    column = "SYMBOL",
    keytype = "ENSEMBL"
  ),
  stringsAsFactors = FALSE,
  row.names = rownames(dds_macrophage)
)
#> 'select()' returned 1:many mapping between keys and columns

# res object
data(res_de_macrophage, package = "GeneTonic")
res_de <- res_macrophage_IFNg_vs_naive

# res_enrich object
data(res_enrich_macrophage, package = "GeneTonic")
res_enrich <- shake_topGOtableResult(topgoDE_macrophage_IFNg_vs_naive)
#> Found 500 gene sets in `topGOtableResult` object.
#> Converting for usage in GeneTonic...
res_enrich <- get_aggrscores(res_enrich, res_de, anno_df)

gs_summary_heat(
  res_enrich = res_enrich,
  res_de = res_de,
  annotation_obj = anno_df,
  n_gs = 20
)