Plot a heatmap for the selected gene signature on the provided data, with the possibility to compactly display also DE only genes
gs_heatmap(
  se,
  res_de,
  res_enrich,
  annotation_obj = NULL,
  gtl = NULL,
  geneset_id = NULL,
  genelist = NULL,
  FDR = 0.05,
  de_only = FALSE,
  cluster_rows = TRUE,
  cluster_columns = FALSE,
  center_mean = TRUE,
  scale_row = FALSE,
  winsorize_threshold = NULL,
  anno_col_info = NULL,
  plot_title = NULL,
  ...
)
Arguments
- se
A
SummarizedExperimentobject, or an object derived from this class, such as aDESeqTransformobject (variance stabilized transformed data, or regularized logarithm transformed), in where the transformation has been applied to make the data more homoscedastic and thus a better fit for visualization.- res_de
A
DESeqResultsobject.- res_enrich
A
data.frameobject, storing the result of the functional enrichment analysis. See more in the main function,GeneTonic(), to check the formatting requirements (a minimal set of columns should be present).- annotation_obj
A
data.frameobject with the feature annotation information, with at least two columns,gene_idandgene_name.- gtl
A
GeneTonic-list object, containing in its slots the arguments specified above:dds,res_de,res_enrich, andannotation_obj- the names of the list must be specified following the content they are expecting- geneset_id
Character specifying the gene set identifier to be plotted
- genelist
A vector of character strings, specifying the identifiers contained in the row names of the
seinput object.- FDR
Numeric value, specifying the significance level for thresholding adjusted p-values. Defaults to 0.05.
- de_only
Logical, whether to include only differentially expressed genes in the plot
- cluster_rows
Logical, determining if rows should be clustered, as specified by
ComplexHeatmap::Heatmap()- cluster_columns
Logical, determining if columns should be clustered, as specified by
ComplexHeatmap::Heatmap()- center_mean
Logical, whether to perform mean centering on the row-wise
- scale_row
Logical, whether to standardize by row the expression values
- winsorize_threshold
Numeric value, to be applied as value to winsorize the extreme values of the heatmap. Should be a positive number. Defaults to NULL, which corresponds to not applying any winsorization. Suggested values: enter 2 or 3 if using row-standardized values (
scale_rowis TRUE), or visually inspect the range of the values if using simply mean centered values.- anno_col_info
A character vector of names in
colData(dds)to use for decorating the heatmap as annotation.- plot_title
Character string, to specify the title of the plot, displayed over the heatmap. If left to
NULLas by default, it tries to use the information on the geneset identifier provided- ...
Additional arguments passed to other methods, e.g. in the call to
ComplexHeatmap::Heatmap()
Value
A plot returned by the ComplexHeatmap::Heatmap() function
Examples
library("macrophage")
library("DESeq2")
library("org.Hs.eg.db")
library("AnnotationDbi")
# dds object
data("gse", package = "macrophage")
dds_macrophage <- DESeqDataSet(gse, design = ~ line + condition)
#> using counts and average transcript lengths from tximeta
rownames(dds_macrophage) <- substr(rownames(dds_macrophage), 1, 15)
dds_macrophage <- estimateSizeFactors(dds_macrophage)
#> using 'avgTxLength' from assays(dds), correcting for library size
vst_macrophage <- vst(dds_macrophage)
# annotation object
anno_df <- data.frame(
gene_id = rownames(dds_macrophage),
gene_name = mapIds(org.Hs.eg.db,
keys = rownames(dds_macrophage),
column = "SYMBOL",
keytype = "ENSEMBL"
),
stringsAsFactors = FALSE,
row.names = rownames(dds_macrophage)
)
#> 'select()' returned 1:many mapping between keys and columns
# res object
data(res_de_macrophage, package = "GeneTonic")
res_de <- res_macrophage_IFNg_vs_naive
# res_enrich object
data(res_enrich_macrophage, package = "GeneTonic")
res_enrich <- shake_topGOtableResult(topgoDE_macrophage_IFNg_vs_naive)
#> Found 500 gene sets in `topGOtableResult` object.
#> Converting for usage in GeneTonic...
res_enrich <- get_aggrscores(res_enrich, res_de, anno_df)
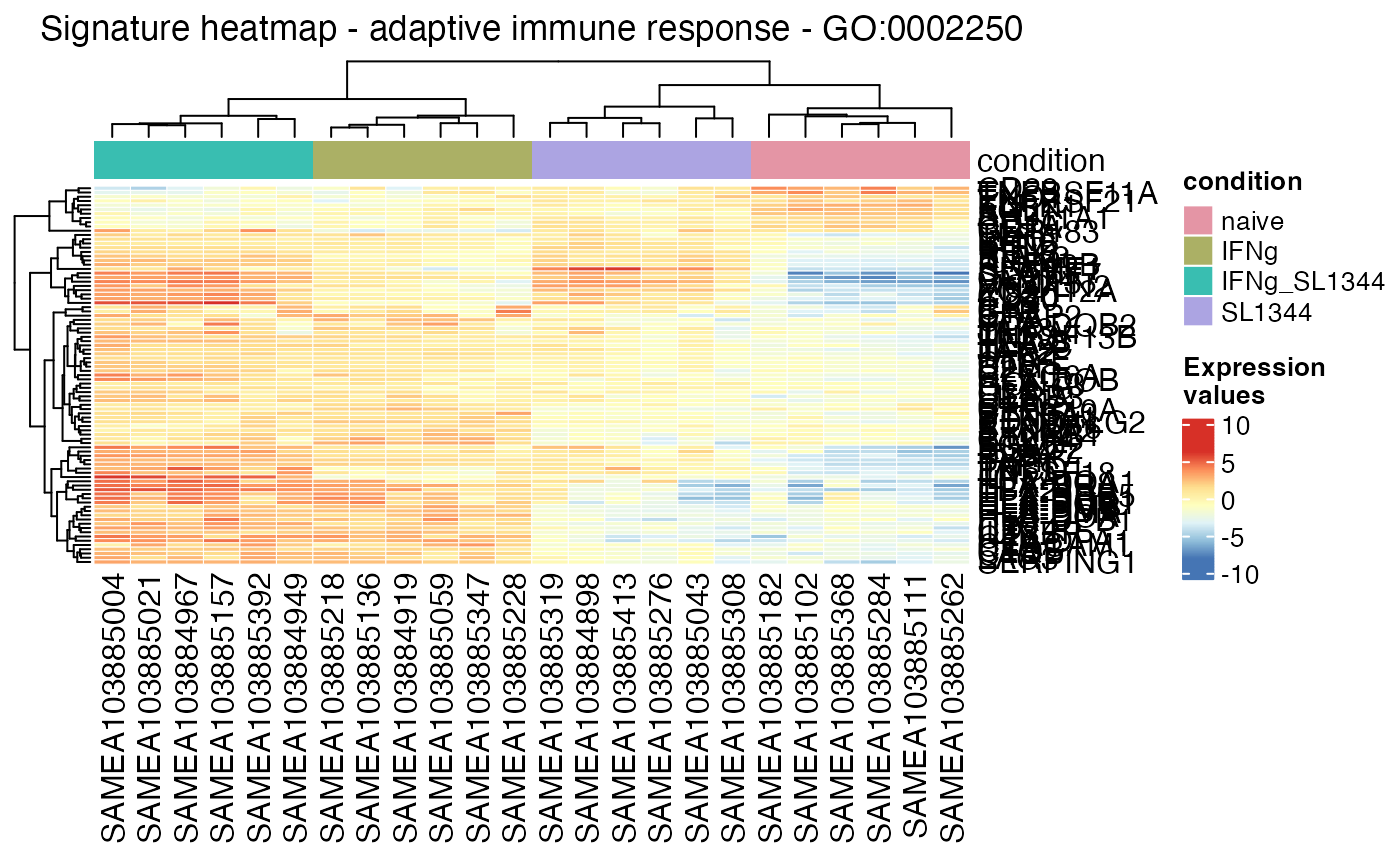
gs_heatmap(vst_macrophage,
res_de,
res_enrich,
anno_df,
geneset_id = res_enrich$gs_id[1],
cluster_columns = TRUE,
anno_col_info = "condition"
)