Extract the backbone for the gene-geneset graph, either for the genes or for the genesets
ggs_backbone(
  res_enrich,
  res_de,
  annotation_obj = NULL,
  gtl = NULL,
  n_gs = 15,
  gs_ids = NULL,
  bb_on = c("genesets", "features"),
  bb_method = c("sdsm", "fdsm", "fixedrow"),
  bb_extract_alpha = 0.05,
  bb_extract_fwer = c("none", "bonferroni", "holm"),
  bb_remove_singletons = TRUE,
  color_graph = TRUE,
  color_by_geneset = "z_score",
  color_by_feature = "log2FoldChange",
  ...
)
Arguments
- res_enrich
A
data.frameobject, storing the result of the functional enrichment analysis. See more in the main function,GeneTonic(), to check the formatting requirements (a minimal set of columns should be present).- res_de
A
DESeqResultsobject.- annotation_obj
A
data.frameobject with the feature annotation information, with at least two columns,gene_idandgene_name.- gtl
A
GeneTonic-list object, containing in its slots the arguments specified above:dds,res_de,res_enrich, andannotation_obj- the names of the list must be specified following the content they are expecting- n_gs
Integer value, corresponding to the maximal number of gene sets to be included
- gs_ids
Character vector, containing a subset of
gs_idas they are available inres_enrich. Lists the gene sets to be included in addition to the top ones (vian_gs)- bb_on
A character string, either "genesets" or "features", to specify which entity should be based the backbone graph on.
- bb_method
A character string, referring to the function to be called ( from the
backbonepackage) for computing the backbone of the specified bipartite graph. Defaults to "sdsm", as recommended in thebackbonepackage.- bb_extract_alpha
A numeric value, specifying the significance level to use when detecting the backbone of the network
- bb_extract_fwer
A character string, defaulting to "none", specifying which method to use for the multiple testing correction for controlling the family-wise error rate
- bb_remove_singletons
Logical value, defines whether to remove or leave in the returned graph the nodes that are not connected to other vertices
- color_graph
Logical value, specifies whether to use information about genesets or features to colorize the nodes, e.g. for this info to be used in interactive versions of the graph
- color_by_geneset
Character string, corresponding to the column in
res_enrichto be used for coloring the nodes ifbb_onis set to "genesets". Defaults to the "z_score", which can be obtained viaget_aggrscores()- color_by_feature
Character string, corresponding to the column in
res_deto be used for coloring the nodes ifbb_onis set to "features". Defaults to the "log2FoldChange", which should be normally included in a DESeqResults object.- ...
Additional parameters to be passed internally
Value
A simple ìgraph object with the graph backbone
Examples
library("macrophage")
library("DESeq2")
library("org.Hs.eg.db")
library("AnnotationDbi")
# dds object
data("gse", package = "macrophage")
dds_macrophage <- DESeqDataSet(gse, design = ~ line + condition)
#> using counts and average transcript lengths from tximeta
rownames(dds_macrophage) <- substr(rownames(dds_macrophage), 1, 15)
dds_macrophage <- estimateSizeFactors(dds_macrophage)
#> using 'avgTxLength' from assays(dds), correcting for library size
# annotation object
anno_df <- data.frame(
gene_id = rownames(dds_macrophage),
gene_name = mapIds(org.Hs.eg.db,
keys = rownames(dds_macrophage),
column = "SYMBOL",
keytype = "ENSEMBL"
),
stringsAsFactors = FALSE,
row.names = rownames(dds_macrophage)
)
#> 'select()' returned 1:many mapping between keys and columns
# res object
data(res_de_macrophage, package = "GeneTonic")
res_de <- res_macrophage_IFNg_vs_naive
# res_enrich object
data(res_enrich_macrophage, package = "GeneTonic")
res_enrich <- shake_topGOtableResult(topgoDE_macrophage_IFNg_vs_naive)
#> Found 500 gene sets in `topGOtableResult` object.
#> Converting for usage in GeneTonic...
res_enrich <- get_aggrscores(res_enrich, res_de, anno_df)
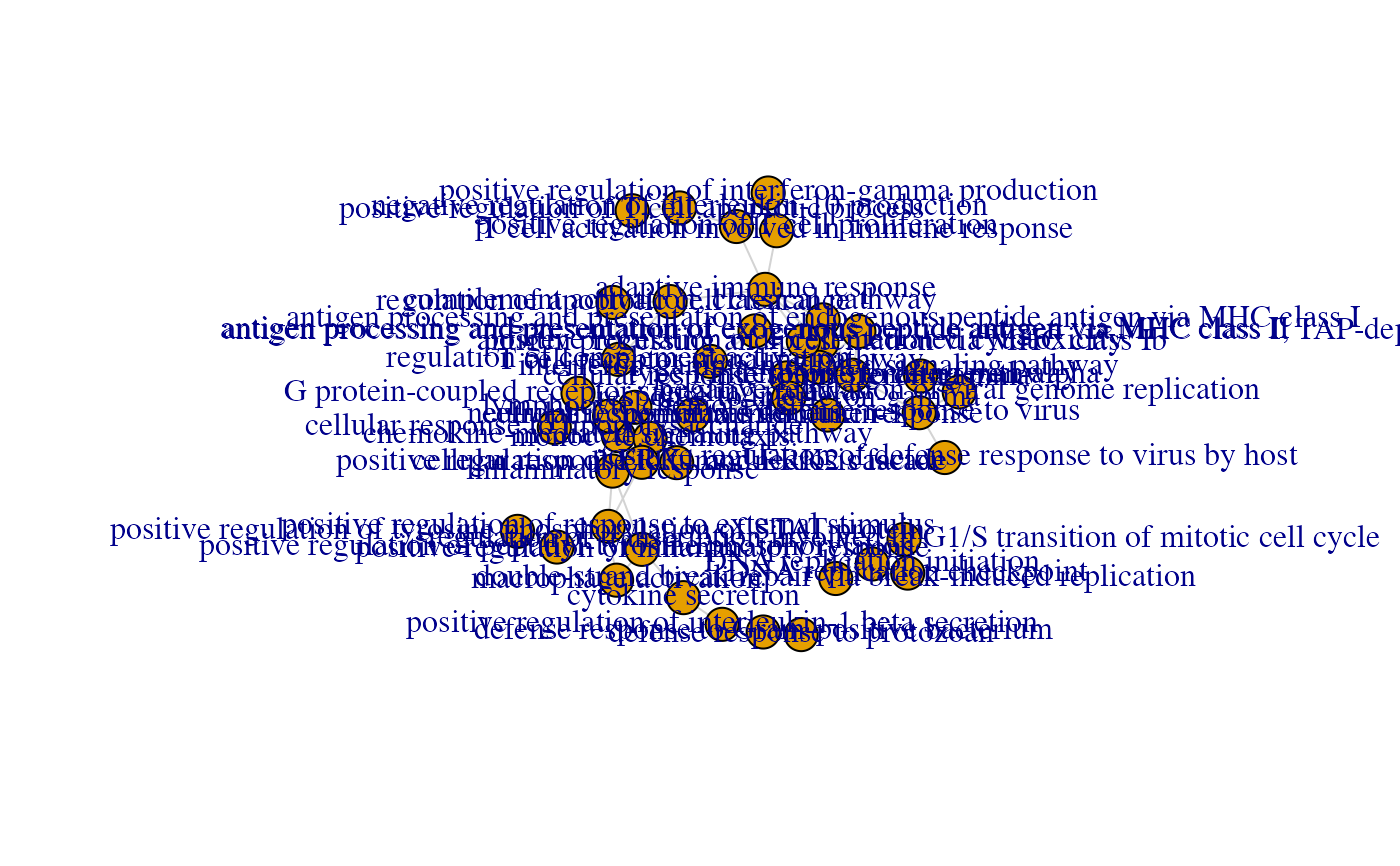
ggs_bbg <- ggs_backbone(res_enrich,
res_de,
anno_df,
n_gs = 50,
bb_on = "genesets",
color_graph = TRUE,
color_by_geneset = "z_score"
)
plot(ggs_bbg)
 # if desired, one can also plot the interactive version
visNetwork::visIgraph(ggs_bbg)
# if desired, one can also plot the interactive version
visNetwork::visIgraph(ggs_bbg)