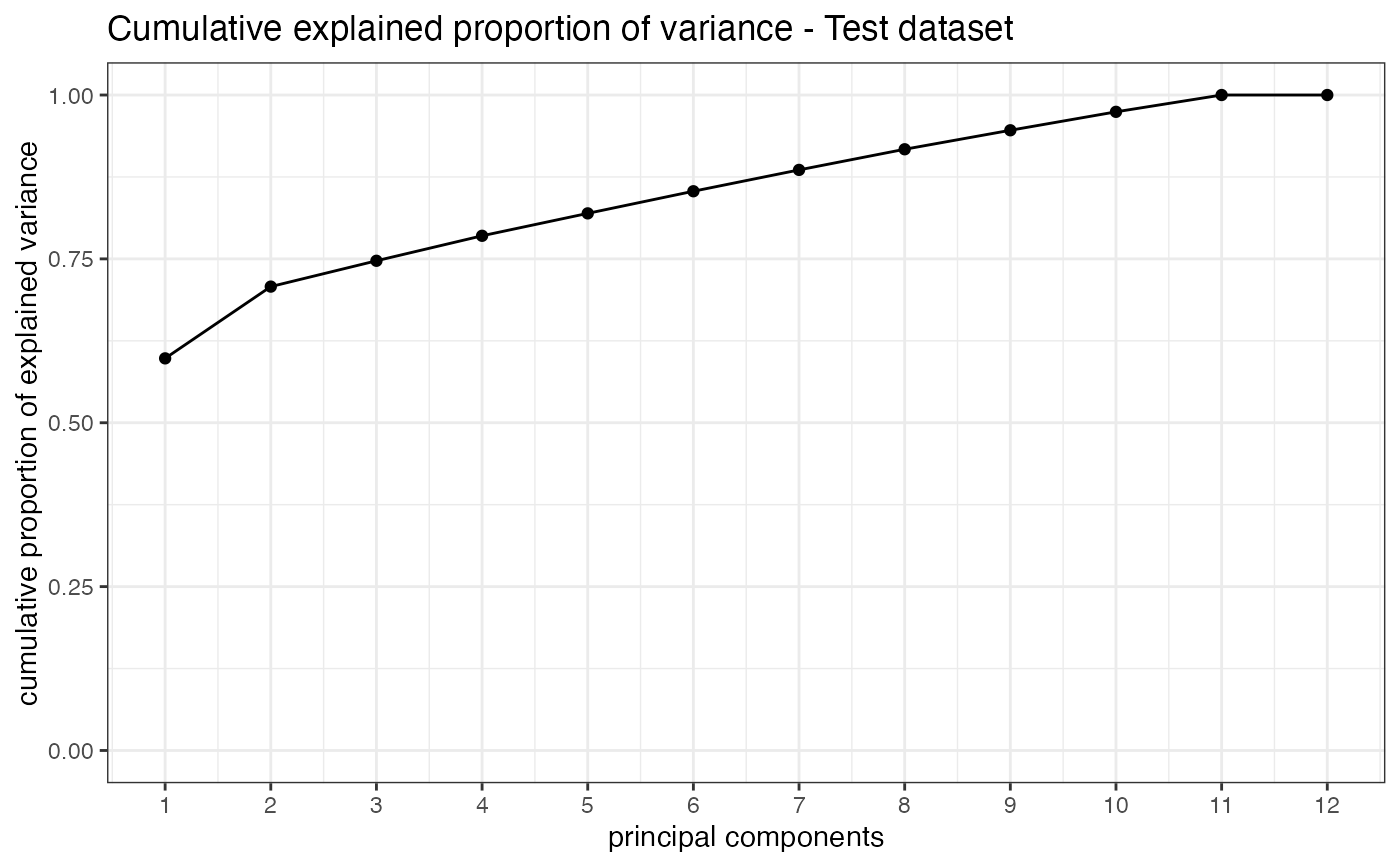
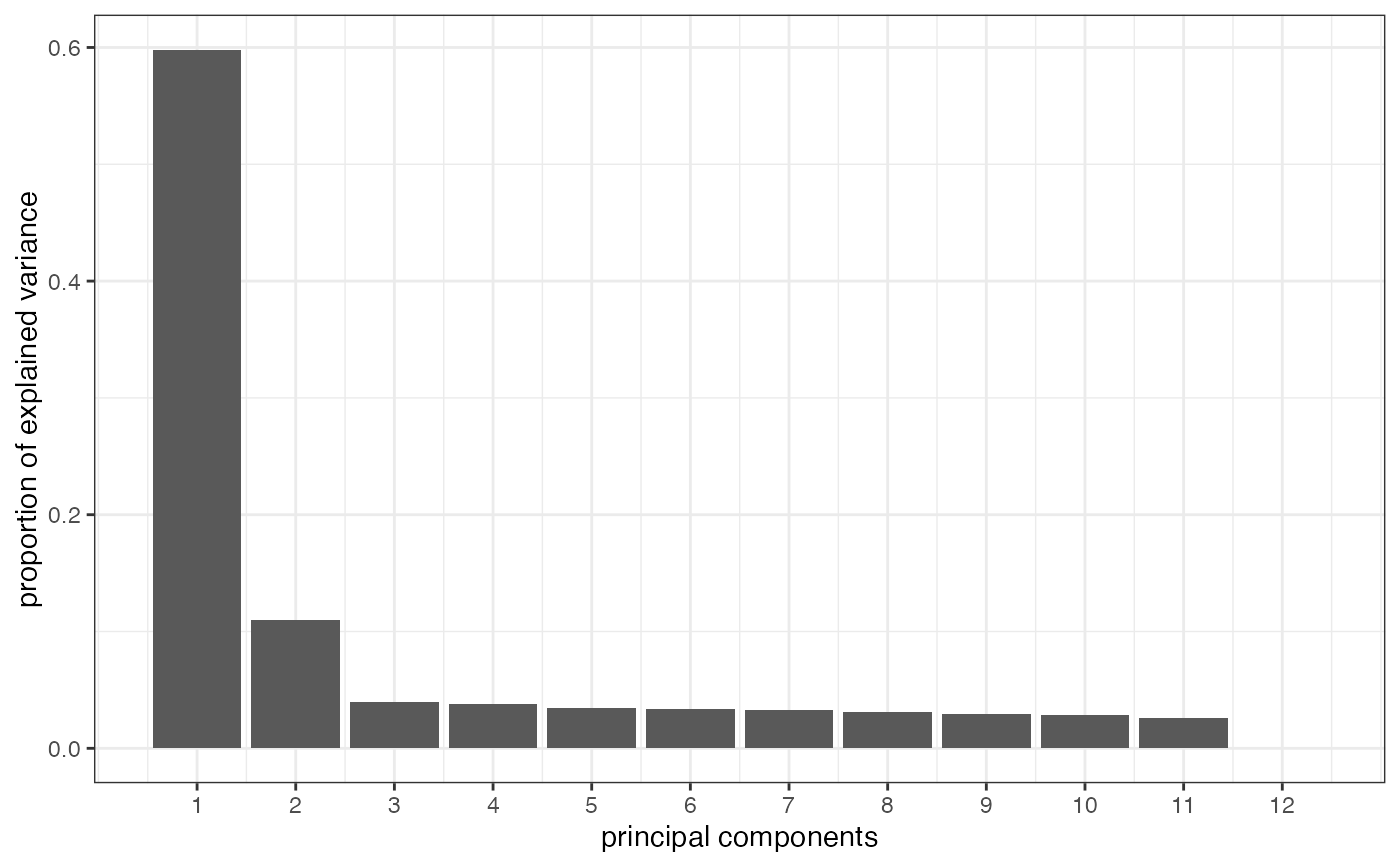
Produces a scree plot for investigating the proportion of explained variance, or alternatively the cumulative value
pcascree(obj, type = c("pev", "cev"), pc_nr = NULL, title = NULL)Arguments
Value
An object created by ggplot, which can be assigned and further customized.
Examples
dds <- makeExampleDESeqDataSet_multifac(betaSD_condition = 3, betaSD_tissue = 1)
rlt <- DESeq2::rlogTransformation(dds)
pcaobj <- prcomp(t(SummarizedExperiment::assay(rlt)))
pcascree(pcaobj, type = "pev")

pcascree(pcaobj, type = "cev", title = "Cumulative explained proportion of variance - Test dataset")