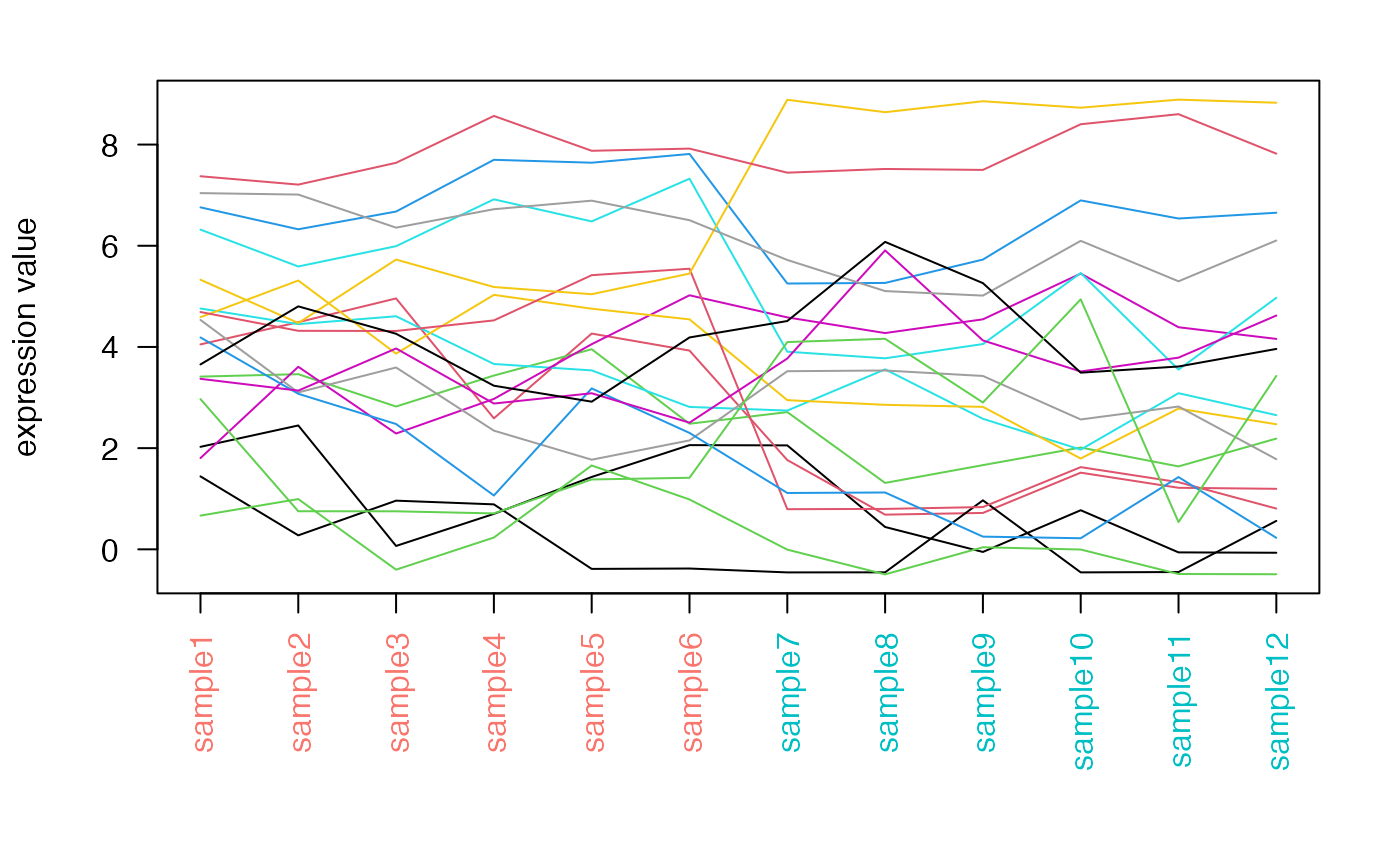
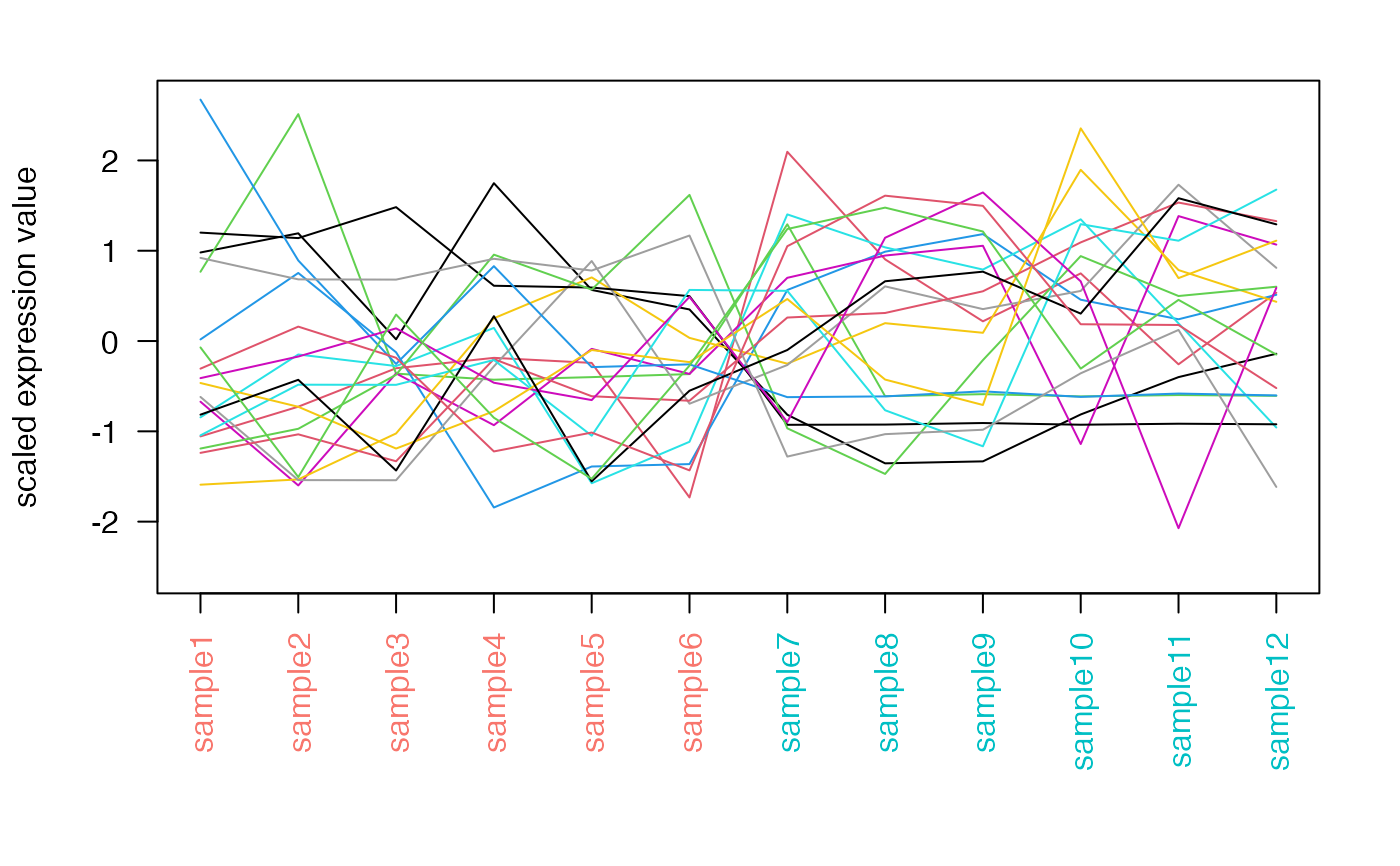
Extract and plot the expression profile of genes
geneprofiler(se, genelist = NULL, intgroup = "condition", plotZ = FALSE)Arguments
- se
A
DESeq2::DESeqDataSet()object, or aDESeq2::DESeqTransform()object.- genelist
An array of characters, including the names of the genes of interest of which the profile is to be plotted
- intgroup
A factor, needs to be in the
colnamesofcolData(se)- plotZ
Logical, whether to plot the scaled expression values. Defaults to
FALSE
Value
A plot of the expression profile for the genes
Examples
dds <- makeExampleDESeqDataSet_multifac(betaSD_condition = 3, betaSD_tissue = 1)
rlt <- DESeq2::rlogTransformation(dds)
geneprofiler(rlt, paste0("gene", sample(1:1000, 20)))
#> You provided 20 unique identifiers
#> 20 out of 20 provided genes were found in the data

geneprofiler(rlt, paste0("gene", sample(1:1000, 20)), plotZ = TRUE)
#> You provided 20 unique identifiers
#> 20 out of 20 provided genes were found in the data
