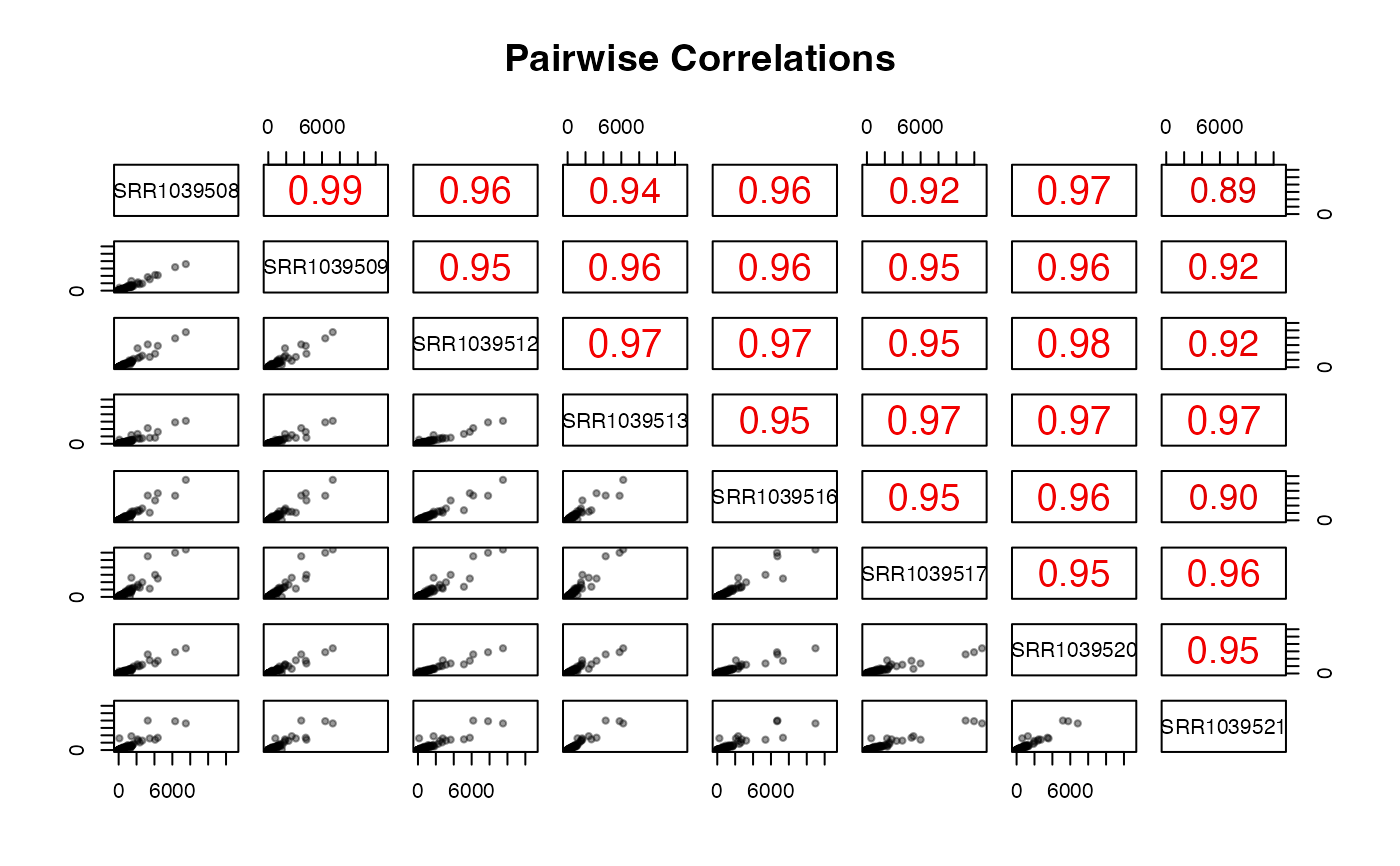
Pairwise scatter and correlation plot of counts
pair_corr(df, log = FALSE, method = "pearson", use_subset = TRUE)Arguments
- df
A data frame, containing the (raw/normalized/transformed) counts
- log
Logical, whether to convert the input values to log2 (with addition of a pseudocount). Defaults to FALSE.
- method
Character string, one of
pearson(default),kendall, orspearmanas incor- use_subset
Logical value. If TRUE, only 1000 values per sample will be used to speed up the plotting operations.
Value
A plot with pairwise scatter plots and correlation coefficients
Examples
library("airway")
data("airway", package = "airway")
airway
#> class: RangedSummarizedExperiment
#> dim: 63677 8
#> metadata(1): ''
#> assays(1): counts
#> rownames(63677): ENSG00000000003 ENSG00000000005 ... ENSG00000273492
#>   ENSG00000273493
#> rowData names(10): gene_id gene_name ... seq_coord_system symbol
#> colnames(8): SRR1039508 SRR1039509 ... SRR1039520 SRR1039521
#> colData names(9): SampleName cell ... Sample BioSample
dds_airway <- DESeq2::DESeqDataSetFromMatrix(assay(airway),
                                             colData = colData(airway),
                                             design = ~dex+cell)
pair_corr(counts(dds_airway)[1:100, ]) # use just a subset for the example