Maps numeric continuous values to values in a color palette
map2color(x, pal, symmetric = TRUE, limits = NULL)Arguments
- x
A character vector of numeric values (e.g. log2FoldChange values) to be converted to a vector of colors
- pal
A vector of characters specifying the definition of colors for the palette, e.g. obtained via
RColorBrewer::brewer.pal()- symmetric
Logical value, whether to return a palette which is symmetrical with respect to the minimum and maximum values - "respecting" the zero. Defaults to
TRUE.- limits
A vector containing the limits of the values to be mapped. If not specified, defaults to the range of values in the
xvector.
Value
A vector of colors, each corresponding to an element in the original vector
Examples
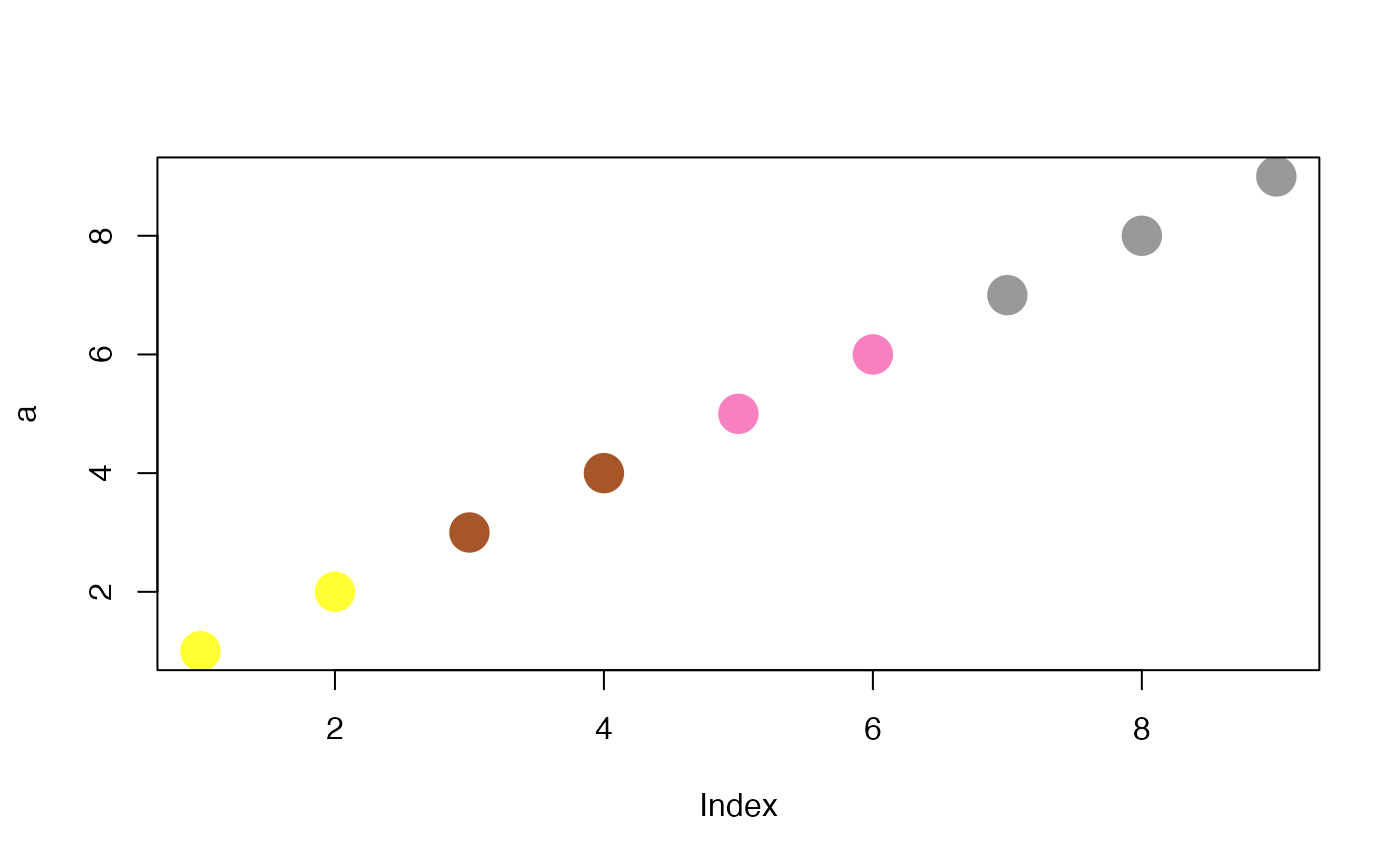
a <- 1:9
pal <- RColorBrewer::brewer.pal(9, "Set1")
map2color(a, pal)
#> Warning: Please use `mosdef::map_to_color()` in replacement of the `map2color()` function, originally located in the GeneTonic package.
#> Check the manual page for `?mosdef::map_to_color()` to see the details on how to use it
#> [1] "#FFFF33" "#FFFF33" "#A65628" "#A65628" "#F781BF" "#F781BF" "#999999"
#> [8] "#999999" "#999999"
plot(a, col = map2color(a, pal), pch = 20, cex = 4)
#> Warning: Please use `mosdef::map_to_color()` in replacement of the `map2color()` function, originally located in the GeneTonic package.
#> Check the manual page for `?mosdef::map_to_color()` to see the details on how to use it


b <- 1:50
pal2 <- grDevices::colorRampPalette(
  RColorBrewer::brewer.pal(name = "RdYlBu", 11)
)(50)
plot(b, col = map2color(b, pal2), pch = 20, cex = 3)
#> Warning: Please use `mosdef::map_to_color()` in replacement of the `map2color()` function, originally located in the GeneTonic package.
#> Check the manual page for `?mosdef::map_to_color()` to see the details on how to use it
b <- 1:50
pal2 <- grDevices::colorRampPalette(
RColorBrewer::brewer.pal(name = "RdYlBu", 11)
)(50)
plot(b, col = map2color(b, pal2), pch = 20, cex = 3)
#> Warning: Please use `mosdef::map_to_color()` in replacement of the `map2color()` function, originally located in the GeneTonic package.
#> Check the manual page for `?mosdef::map_to_color()` to see the details on how to use it