This function implements the Markov Clustering (MCL) algorithm for finding community
structure, in an analogous way to other existing algorithms in igraph.
cluster_markov(
  g,
  add_self_loops = TRUE,
  loop_value = 1,
  mcl_expansion = 2,
  mcl_inflation = 2,
  allow_singletons = TRUE,
  max_iter = 100,
  return_node_names = TRUE,
  return_esm = FALSE
)
Arguments
- g
The input graph object
- add_self_loops
Logical, whether to add self-loops to the matrix by setting the diagonal to
loop_value- loop_value
Numeric, the value to use for self-loops
- mcl_expansion
Numeric, cluster expansion factor for the Markov clustering iteration - defaults to 2
- mcl_inflation
Numeric, cluster inflation factor for the Markov clustering iteration - defaults to 2
- allow_singletons
Logical; if
TRUE, single isolated vertices are allowed to form their own cluster. If set toFALSE, all clusters of size = 1 are grouped in one cluster (to be interpreted as background noise).- max_iter
Numeric value for the maximum number of iterations for the Markov clustering
- return_node_names
Logical, if the graph is named and set to
TRUE, returns the node names.- return_esm
Logical, controlling whether the equilibrium state matrix should be returned
Value
This function returns a communities object, containing the numbers of
the assigned membership (in the slot membership). Please see the
igraph::communities() manual page for additional details
Details
This implementation has been driven by the nice explanations provided in
https://sites.cs.ucsb.edu/~xyan/classes/CS595D-2009winter/MCL_Presentation2.pdf
https://medium.com/analytics-vidhya/demystifying-markov-clustering-aeb6cdabbfc7
https://github.com/GuyAllard/markov_clustering (python implementation)
More info on the MCL: https://micans.org/mcl/index.html, and https://micans.org/mcl/sec_description1.html
References
van Dongen, S.M., Graph clustering by flow simulation (2000) PhD thesis, Utrecht University Repository - https://dspace.library.uu.nl/handle/1874/848
Enright AJ, van Dongen SM, Ouzounis CA, An efficient algorithm for large-scale detection of protein families (2002) Nucleic Acids Research, Volume 30, Issue 7, 1 April 2002, Pages 1575–1584, https://doi.org/10.1093/nar/30.7.1575
Examples
library("igraph")
#>
#> Attaching package: ‘igraph’
#> The following object is masked from ‘package:GenomicRanges’:
#>
#>     union
#> The following object is masked from ‘package:IRanges’:
#>
#>     union
#> The following object is masked from ‘package:S4Vectors’:
#>
#>     union
#> The following objects are masked from ‘package:BiocGenerics’:
#>
#>     normalize, path, union
#> The following objects are masked from ‘package:generics’:
#>
#>     components, union
#> The following objects are masked from ‘package:stats’:
#>
#>     decompose, spectrum
#> The following object is masked from ‘package:base’:
#>
#>     union
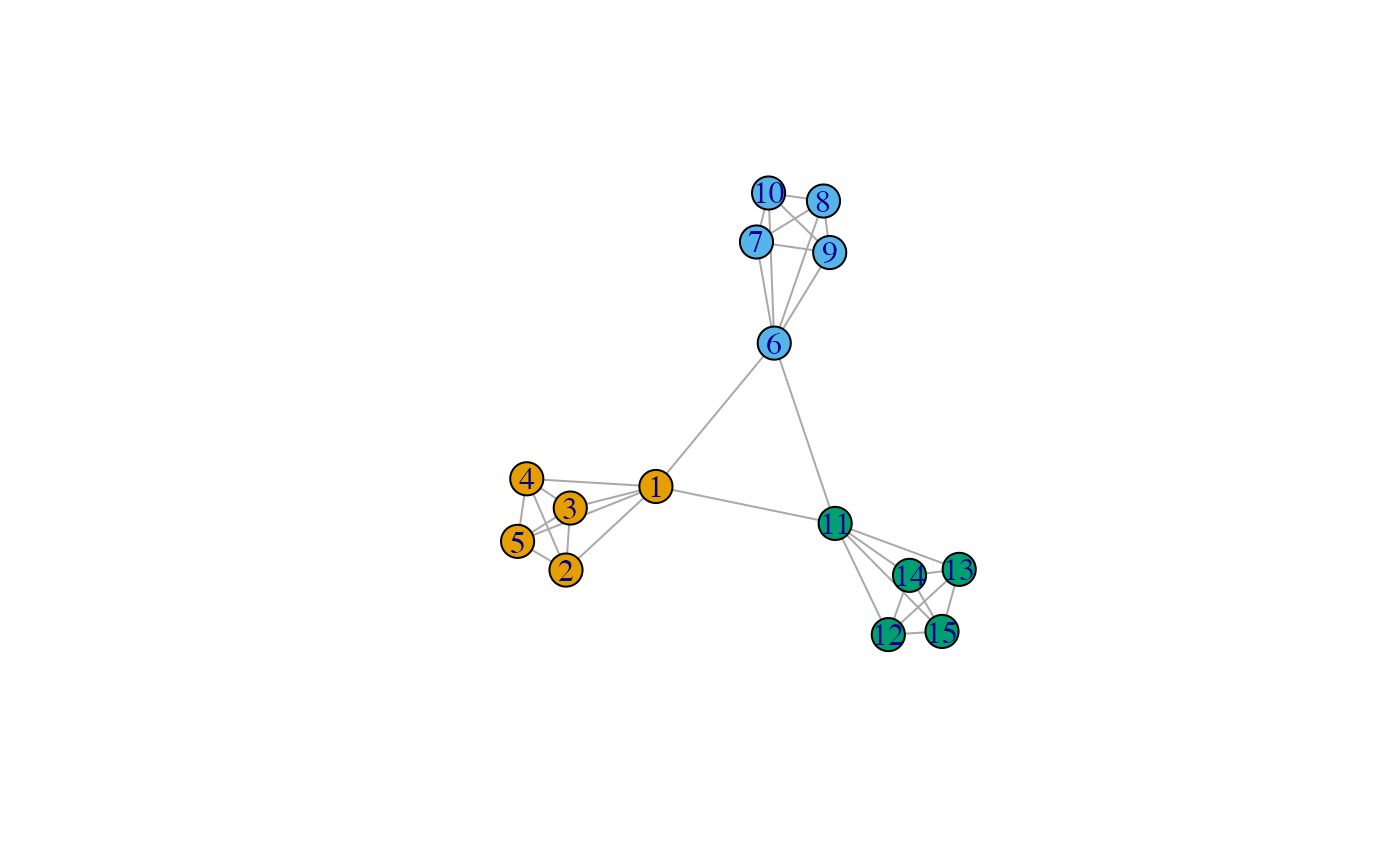
g <- make_full_graph(5) %du% make_full_graph(5) %du% make_full_graph(5)
g <- add_edges(g, c(1, 6, 1, 11, 6, 11))
cluster_markov(g)
#> IGRAPH clustering mcl, groups: 3, mod: NA
#> + groups:
#>   $`1`
#>   [1] 1 2 3 4 5
#>
#>   $`2`
#>   [1]  6  7  8  9 10
#>
#>   $`3`
#>   [1] 11 12 13 14 15
#>
V(g)$color <- cluster_markov(g)$membership
plot(g)
